PowerBI Dashboard
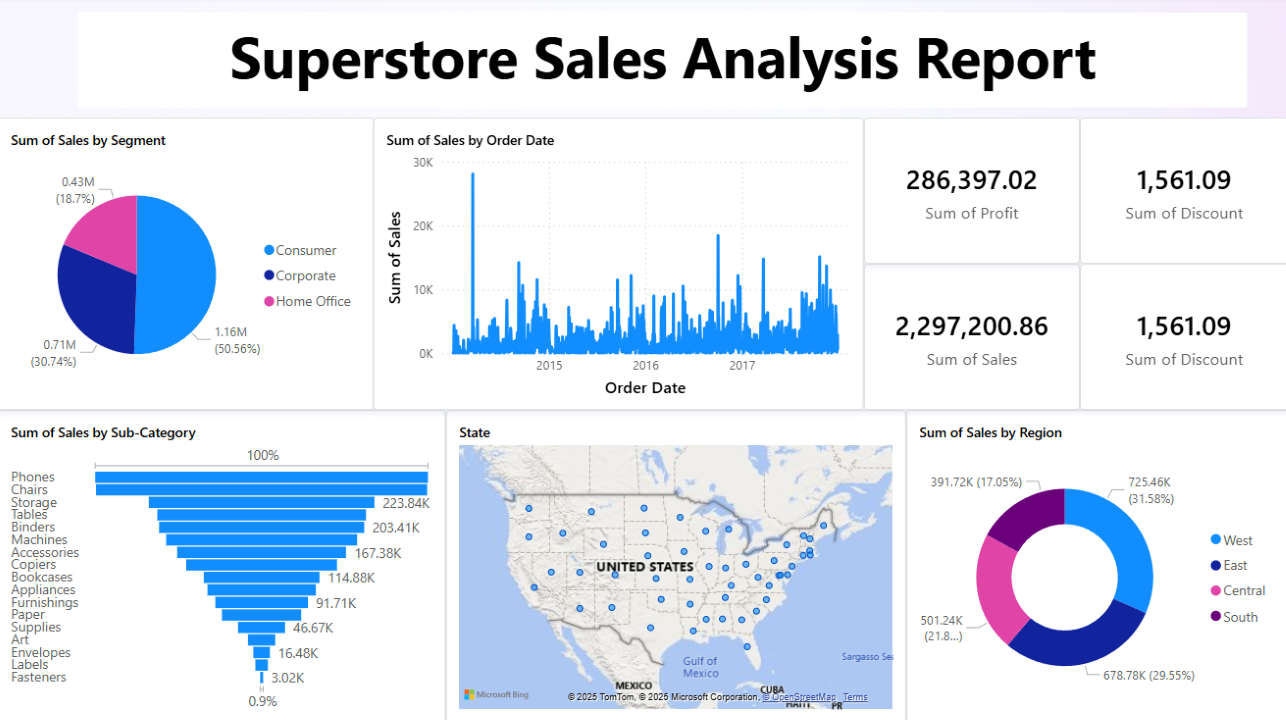
This project, the Retail Sales Performance Dashboard, was created to analyze and visualize sales performance for a retail chain using the Superstore Dataset Final by Vivek Chowdhury (available at https://www.kaggle.com/datasets/vivek468/superstore-dataset-final). Starting with raw data, I preprocessed it using Python and the Pandas library to handle missing values, standardize dates, and calculate profit margins, saving the cleaned dataset as cleaned_superstore.csv. The interactive dashboard, built in PowerBI, features, an array of graphs and charts including a state map of sales locations. The report is interactive and can change when looking into certain locations or segments.
The project was developed in Visual Studio Code, with the codebase and assets managed and uploaded to a GitHub repository. Screenshots of the dashboard were captured and integrated into the portfolio for visual appeal. This work demonstrates skills in data cleaning, visualization, and project presentation, making it a valuable addition to my portfolio.
- Data Encoding Issues
- PowerBI Learning Curve
- GitHub Upload
- Functional Dashboard
- Portfolio Enhancement
- Skill Development
Interested in discussing this project?